Keep a Critical View of Key Metrics to understand the user behavior and IVA performance
Get a 360-degree view of all the critical metrics like intent identification rate, returning users data, goal completion rate, and more, and easy drill down to specific dashboards. It helps leaders to glance at the key metrics quickly.
coding needed
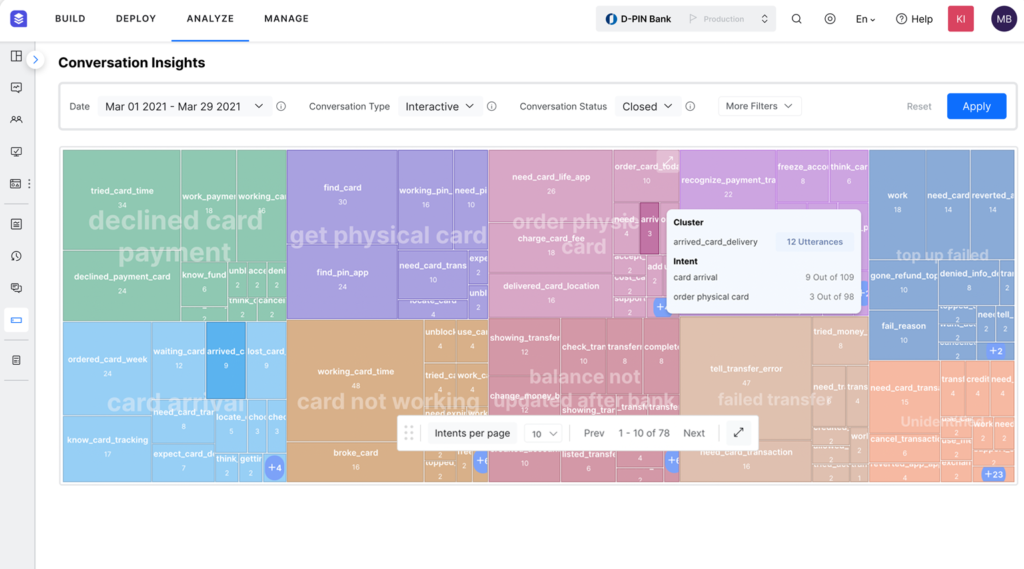
Conversation Insights
Enhance the IVA Training by uncovering false positives and negatives
Efficiently identify training issues from millions of utterances using the interactive visual map. It organizes utterances based on semantic meaning and maps to intents. Quickly review false positives, false negatives, and true negatives to either train existing or create new intents. Add follow-up actions easily to train dialogs and FAQ intents.
Make data-driven decisions by analyzing usage and containment metrics
Conversations Dashboard presents sessions, containment, and engagement trends, with the breakup of self-service, drop-off, and agent sessions. Further, you can see session distribution by channel, most active hours, conversation path and engagement analysis, and data on conversation and message trends.
This dashboard provides invaluable insights into how your customer interacts with the virtual assistant.
Conversation Sessions
Track the total number of conversations between the virtual assistant and a user in a specific period.
Self-service
Check the virtual assistant’s efficiency in resolving user queries – it includes sessions where a user successfully completes an interaction.
Drop-off
Track conversation sessions where the user has abandoned mid-way, the conversation ended with an error or there is no response from the assistant.
Agent Transfer
Check out the total conversation sessions the live agent handles. It happens when the conversation reaches to Agent-Transfer node.
Users Dashboard
Assess user behavior by tracking the user interaction data
The Users Dashboard displays the count of users interacting with the virtual assistants. You will see a breakup of new and returning users that helps you assess user trends and retention status.
The user data is invaluable as you can identify the user trends, active and inactive users, new and returning users over a specific period and more.
User Trends
Have a clear vision of how many users interact with your virtual assistant. Track and compare total, new, and returning users for a given period.
Returning User
Track the users who have repeated interactions with the virtual assistant. It displays the information based on the channel or browser of communication.
Cohort Analysis
Monitor new users and the percentage of returning users weekly for consecutive days and determine the retention rate. The data visualization chart displays the Day N retention of daily, weekly, or monthly cohorts.
Performance Dashboard
Deliver extraordinary experiences by monitoring the IVA performance and executing changes
Performance Dashboard provides insights about virtual assistants’ performance, focusing on intent identification rate, goal completion rate, API and script execution rate.
It will help the VA designer to take necessary measures to enhance the assistant’s performance further.
Intent Identification
Analyze the VA’s intent identification capabilities. Track intent identification trend, popular intents identified and utterances unidentified.
Goal Completion
Assess the task execution rate of the virtual assistant. Gain insights into the task completion—track failure point analysis at each node.
API Execution
The dashboard provides insights into the total number of API calls that the virtual assistant executed successfully.
Script Execution
It shows all the successful, failed, and the total number of scripts executed and the average execution time.
Custom Dashboards
Track Custom Metrics to monitor business KPIs
Custom dashboards help you track business-specific custom key metrics and are now easy to construct. The latest version offers a no-code UI that assists business users in developing widgets and measuring KPIs. The latest handy filters let you drill down the data to a specific message, user, or session tag. For example, track business metrics for every store or region separately.
Build one or more custom interactive dashboards by applying the date range and adding widgets to display the configured data. You can also export the dashboard in JSON format.
Drag-and-Drop Widgets
Add one or more widgets to retrieve and represent information associated with the set of predefined datasets. Configure query definition to specify what information should be retrieved and represented on a Widget.
Meta Tags
Add Custom Meta Tags to the conversation flows; profile the user conversations and derive business-critical insights from the usage and execution metrics.
NLP Insights
Gain in-depth insights into the NLP and optimize the training
Learn how virtual assistants respond to end user queries. Get greater visibility into the performance – see the intents identified, intents not unidentified, unhandled utterances and failed tasks. Mark critical items and view them in the Pinned tab.
Further, you can view all the scripts and API services across the VA tasks from a single window. Review and enhance the performance by taking corrective actions.
Get information about all the user utterances successfully mapped to a trained intent, including the dialog tasks triggered by KG intents.
Intent Not Found
Contain all the user utterances that the platform could not map to a virtual assistant intent/FAQ.
Failed Task
Analyze all the user utterances that are successfully mapped to intent, but the task is incomplete.
Unhandled Utterances
Presents the unhandled utterances at entity and confirmation nodes for you to review and improve the prompts and also identify new intents.
Debug Log
Track all the custom statements that you have added at the script node.
Conversations History
Analyze every interaction by tracking the summary and chat history
The conversations history dashboard offers a consolidated view of all the virtual assistant conversations, a detailed flow summary and critical events, including intent identification, completed and failed tasks, flow errors and more.
You can further view the conversation flows and transcript. The analysis helps you to understand better what, why and how end users are interacting with your virtual assistant.
Conversations History
View the interaction summary with various events triggered during the conversation.
Chat History
View the entire chat history and navigate to other conversations of the user
Add Labels
Add labels to identify the conversations that need follow-up for NLP updates, flow corrections, etc.
Conversation Flows
Trace user journey with an interactive visual representation
Map popular user paths and exit points with the Sagle.ai XO platform’s powerful session flow visualization tool. It gives you a comprehensive view of messages and tasks at a specific point in a conversation. You can even drill down to a particular user to view complete chat transcripts and debug context.
It provides the following flows –
Intent flow – Understand how virtual assistant’s intents are identified and executed.
Session flow – View user journeys across the different intents during execution.
Grouped Utterances
Every flow starts with an utterance from the user that initiated the conversation and expands to show further interactions. These utterances are grouped based on similarity ignoring the stop words and values for entities.
Nodes
Nodes are the individual points plotted on the conversation flow across various levels. Only the nodes that need input from the user are plotted on the graph.
Chat History
Chat History can be seen on clicking the utterance from the User Utterance window for either input (percentage) or response information.
Gartner
Sagle.ai Named a Leader in 2023 Gartner® Magic Quadrant™ for Enterprise Conversational Al Platforms